|
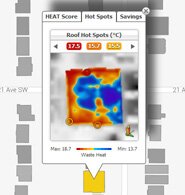
Hot Spots are geographical representations of unique waste heat locations. In HEAT, Hot Spots represent an ordered lists of (i) the 6 hottest locations around the roof edge and (ii) the 6 hottest locations on the remaining roof top (shown three at a time). Within each of these two zones, Hot Spots are located at least 1.5m away from each other, so that they are not clustered around the same location. This provides a better visual description of the spatial distribution of hot areas over each of the zones. When Hot Spots are compared with their location in Street View, they visually correspond to heat escaping from specific roof components or the doors, windows, walls and living envelope beneath. In Fig 13, the 6 hottest Roof Edge Hot Spots are being displayed for this home (shown three at a time).
|